Introduction
The Map Window in ƒh8 can do a good deal more than show markers. You can draw on maps, lay historic boundaries over them, save them and put them in books. This article covers what is new for anyone who knows the Map Window from earlier versions. For geocodingGeocoding is the process of converting addresses/places (like a street address) into geographic coordinates (latitude and longitude), which you can use to place markers on a map. placesAccording to GEDCOM, a Place should hold "The jurisdictional name of the place where the event took place…" and addresses"The address structure should be formed as it would appear on a mailing label…", according to GEDCOM; however, this is capable of a number of interpretations, and Address and Place are best considered together., see Geocoding and the Map Window; for marker sets, see Marker Sets in the Map Window.
Addresses on Maps
Addresses are now records with their own latitude and longitude, so eventsEvents are things that happened to an Individual and Attributes are things that described them. can be mapped by address, by place, or by address where there is one and place otherwise (“address preferred”). There is a marker set type for Address records too. Places are geocoded automatically; addresses are not, and have to be located one at a time. See Working with Places and Addresses in Version 8.
Marker Sets and Markers
The Marker Set pane has been redesigned so that several marker sets are easier to manage at once. Whole sets can be hidden or shown, and copied and pasted.
Markers can show a short form of the place or address name underneath them: right-click on the map to switch this marker text on or off. You can also find every marker within a given distance of a point, shade the area searched, and send the events for those markers to the Results Window for a closer look.
Shapes and Text
You can draw on maps with lines of several segments, polygons, circles and text. Shapes scale with the map as you zoom. Their opacity can be set, so a region can be shaded without hiding what is underneath. They can be grouped, ordered, formatted together, and copied and pasted between maps.
Text is anchored to a point on the map and can have a callout line to it. Each text shape has a reference zoom, which controls how it scales, so that labels stay readable when you zoom in or out.
Changes to shapes can be undone and redone. A shape can be locked, after which it behaves as part of the map and clicking on it does nothing; the Access button on the map toolbar unlocks them for editing. See Add and Edit Shapes and Map Shape Format Dialog.
Overlays
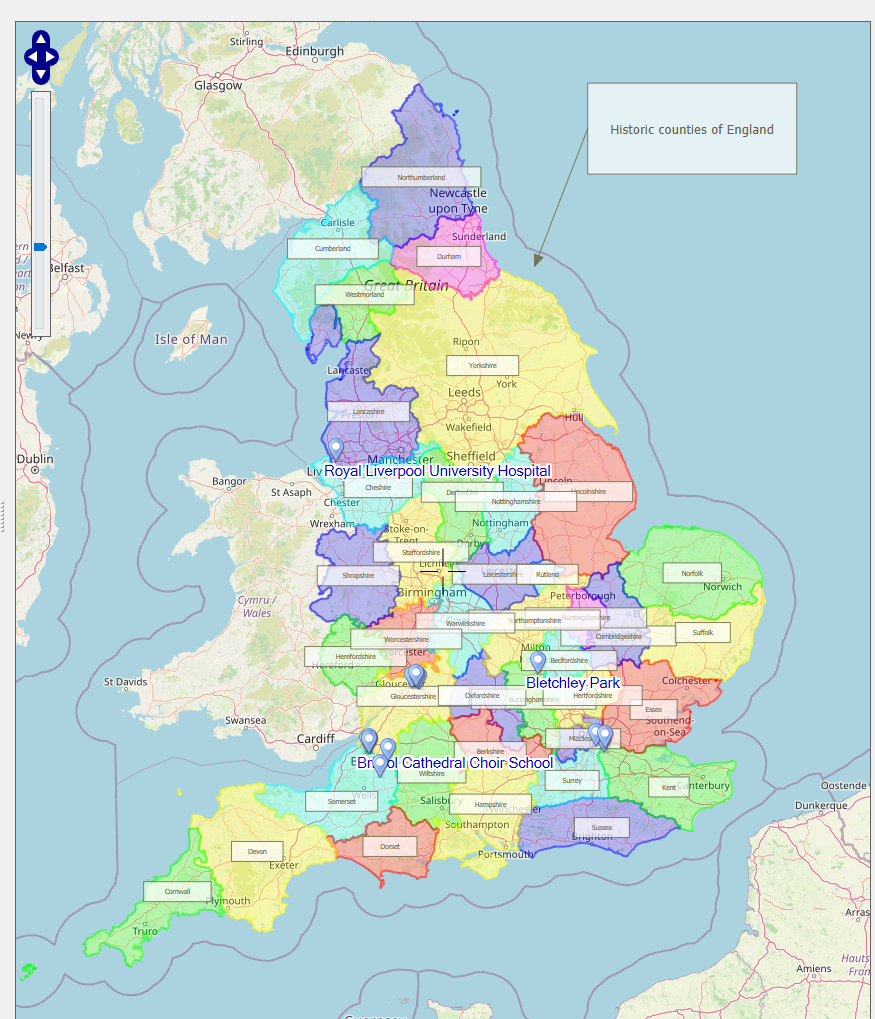
An overlay is a saved set of shapes, usually locked, that can be laid over any map. ƒh8 comes with several: the historic counties of England, Scotland, Wales and Northern Ireland among them, along with the Roman Empire, the former Soviet Union and the United States at the start of the Civil War. To see them, click the Map button on the main toolbar and choose Map Overlays.
Any set of shapes you draw can be saved as your own overlay. The Map Overlays dialog lets you rename, copy, delete and describe overlays, and import and export them to share with others. It will also import geoJSON files, which are widely available online; these are often far more detailed than ƒh needs, and the Simplify button thins them out so the map stays responsive. See Map Overlays Dialog.
Saving and Using Maps
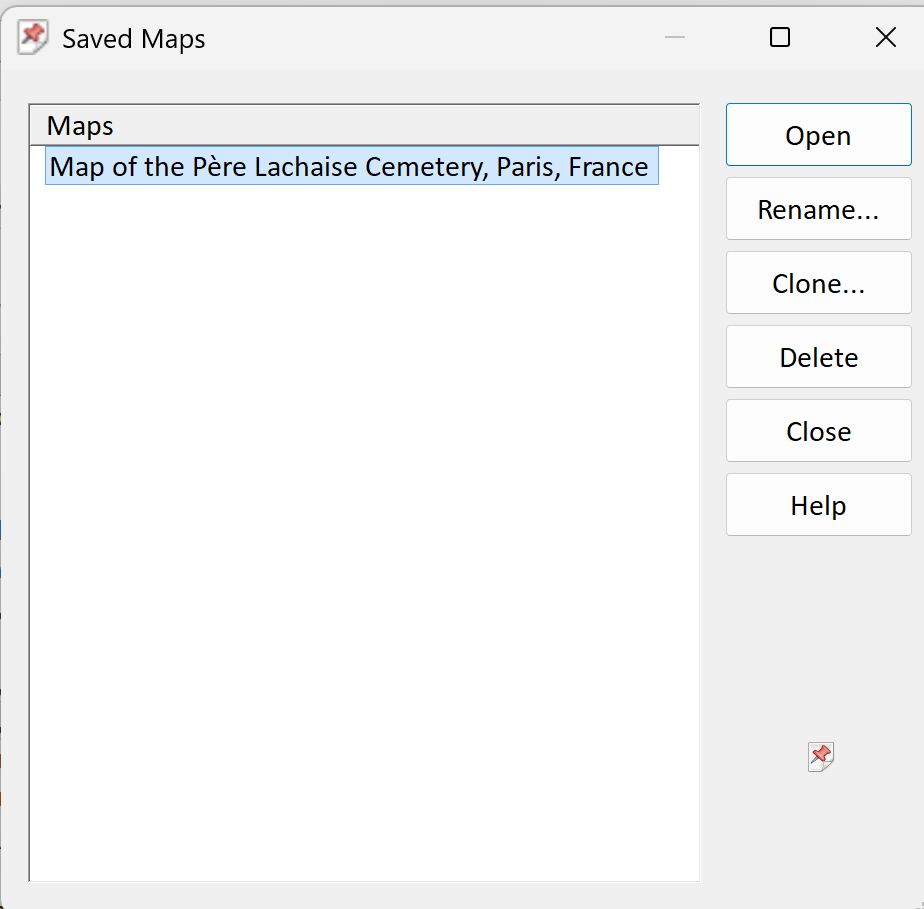
A map, with its position, marker sets and shapes, can be saved within the projectA Project is a Windows folder, created by Family Historian, which contains all your Family Tree information recorded in Family Historian. Normally located in the Documents\Family Historian Projects folder. and opened again later: choose Saved Maps from the Map button. See Saved Maps Dialog.
A map can also be saved as a Media recordWhen you add a picture, video, sound recording, document file etc into a Family Historian project, a Media record is created to represent that media item within the project; the Media record includes a link to the actual Media file. or as a JPEG image, which makes it easy to use in reports, books and websites. Right-click on the map background and choose from the Save Map As submenu, which is also on the Mapping menu. See Save Map as Media Record Dialog and Including Maps in Diagrams and Books.