I use Mike's method to produce exactly what I think you are looking for (with redactions for privacy).
- Chart.JPG (103.64 KiB) Viewed 3155 times
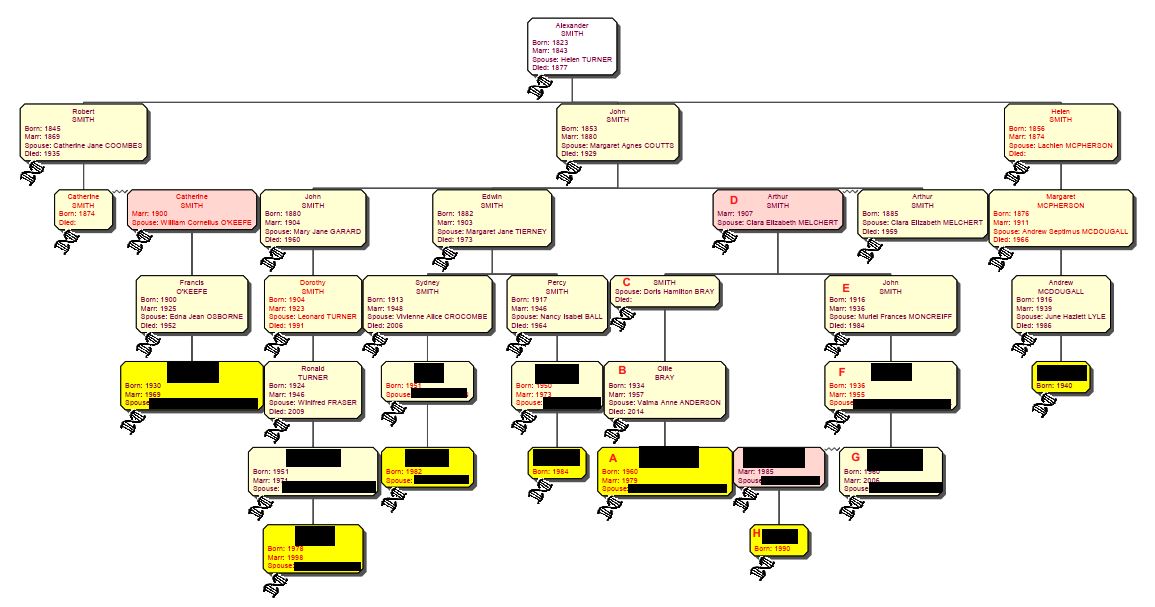
All those with yellow highlight boxes have matching segments of DNA. Note the lines shown here are not all the descendants, only those who have done a DNA test, (although of course I could produce a chart of all descendants and the DNA icon would still only be on those lines where there was a tester).
When I get a DNA match (I am the red A on the chart), with H, I add the DNA Marker attribute to myself, my father (B), his father (C), and his father (D), then work my way back down to match H. In the marker I put the name of the shared ancestors, so for that particular match it would be: SMITH:MELCHERT, and I also put other information, such as the company tested with, the quality of the match (cM and number of shared segments) and the name & number of the person I match.
This means when you look at the match between A & H their paper trail back to D is proven by the shared DNA. The more this happens in the tree the more confidence you can have in the results (eg if you only have one other match then it IS possible that your match to them could potentially be through another line that you haven't realised).
I find this chart very useful for other family members to see what is going on. The only downside so far, is that because of the many matches, I have many DNA Marker facts on my record, but I have them turned off in other Reports, so it is really only a minor thing.
I would really love to be able to display the DNA icon near the name on the Focus Window as well, but the only real way I can think to do that (at this stage) is put a media picture to display and I really don't want to do that at this stage.